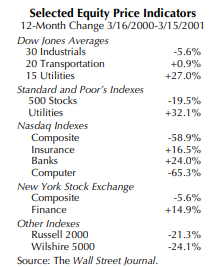
What a difference a year makes. The percentage changes in various stock price indexes from March 16, 2000, to March 15, 2001, were as shown in the accompanying table. All of the broad indexes are below their historical peaks and the prices of high-flying tech stocks, which had risen far beyond any standard of value, have collapsed farther and faster than any other sector. A sea-change in investor sentiment appears to be underway as investors become disabused of the notion that price decreases are short-lived “buying opportunities” because prices will inevitably rise to new highs.
The market’s huge losses, coming on the heels of the extraordinary gains from 1995 to 1999, have left investors confused and highly uncertain. Has the market hit bottom or are further decreases likely? Do prices still reflect the “irrational exuberance” mentioned by Federal Reserve Chairman Greenspan in a 1996 speech, when the Dow was at 6,400? Are stocks now “rationally” priced? Or will they be driven by “irrational pessimism” to levels well below the long-term underlying value of businesses?
There is no simple calculus for determining whether common stocks are a “good value.” Over the long-term, however, there clearly is a relationship between market valuations and other measures of corporate value. As the following analysis of broad market indicators suggests, this relationship has varied greatly over the years.
The most comprehensive measure of stock values is the total market value of common stocks as estimated by the Federal Reserve Board. This series includes equities of mutual funds and other financial intermediaries that hold common stocks themselves. To avoid “double counting” and to facilitate comparisons with other series published by the Federal Reserve, we focus on the market value of the equities of non-financial corporate businesses (NFCBs). According to newly released data, this was estimated to total $12.35 trillion at the end of 2000.
Only a year ago, at the end of the first quarter of 2000, the value of this series reached $15.68 trillion, a record high. Thus, during the nine months from March to December of last year, the market value of the equities of NFCBs decreased $3.33 trillion, or 21 percent. Measuring the decline from the end of 1999 (when prices had not yet peaked), market value declined last year by 18.3 percent, the largest annual decrease since 1974.
A share of common stock is ultimately a claim on the assets held by the corporation that issued it. Such claims are subject to prior claims, mainly any indebtedness of the company. Chart 1 shows the market value of the equities of NFCB’s as a percent of the “net worth” (assets less liabilities) of NFCBs, measured in two ways. One, using the historical cost of tangible assets (real estate, equipment, software, and inventories) less prior claims, is the “book value” of the equity in NFCBs. The other uses either the market value or the “replacement cost” of the assets to determine the value of equity.
After increasing during the 1950s and ’60s, these percentages decreased markedly between 1972 and 1974 to levels that were roughly equivalent to those of the early 1950s. By 1994 they had returned to their peaks of the 1960s. After stock prices took off in 1996, both percentages increased rapidly to levels that were not only unprecedented but, from a historical perspective, astonishing. By the end of 1999, equities were trading at 280 percent of book-value net worth, compared with 155 percent at the 1968 peak, and 195 percent of replacement-cost net worth, compared with 105 percent in 1968.
By the end of 2000, these measures of relative valuation had dropped precipitously. Data for the first quarter of 2001 are not yet available, but clearly they have decreased further. Even so, equities probably still are trading at a premium to net worth, and probably at a level that still is high when viewed from a historical perspective.
Investors focus on balance sheets only in unusual circumstances, such as mergers, bankruptcies, etc. It is the ability to generate funds from operations as ongoing businesses that usually concerns investors. Chart 2 shows the year-end market value of the equities of NFCBs in relation to three measures of this. These aggregates are dividends, earnings, and cash flow.
The first of these, dividends paid, is the most unambiguous. Earnings provide a less reliable measure of corporations’ reported flows because they are affected by adjustments for inventory and depreciation and the figures reported to stockholders may differ from those reported on tax returns (from which our data are derived). To derive the earnings measure used in our chart, we exclude “phantom” gains (or losses) attributable to increases (or decreases) in the prices of current inventories. We also adjust depreciation charges to reflect replacement cost, and add the retained earnings of the foreign subsidiaries of NFCBs, which are not included on tax returns. Cash flow is the sum of earnings and depreciation charges and is unaffected by the adjustments to depreciation charges (higher depreciation charges mean lower earnings and vice versa).
As shown, the market value of equities in NFCBs increased to 61 times dividends in 1999. The previous peak, reached in 1972, was 53. Stock valuations also reached records that were well above previous peaks in relation to earnings and cash flow. By the end of 2000 these multiples had declined markedly.
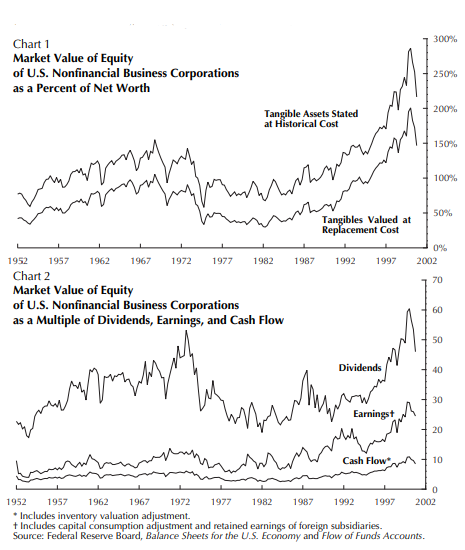
Almost certainly they have since declined further. At this point they probably still are in the high end of their historical range. However, there is no reason to believe that valuations are bound to decrease toward the bottom portion of that range anytime soon. After all, valuations fluctuated at relatively high levels between 1960 and 1972.
The most striking aspect of these charts is that the relatively short-term stock market ups and downs that most observers call “bull” and “bear” markets appear as relatively minor blips within the much longer trends of valuation levels. Although our data go back to only 1952, there is evidence that common stock valuations during the late 1920s were comparable to those reached in the 1960s and the 1990s. Also, the low valuations of the mid-1970s through the mid-1980s probably were comparable to the levels of the 1930s and 1940s.
We do not believe that there is any inherent cyclicality to common stock valuation levels in any rigid or time-delimited sense. What this record shows, rather, is that common stock valuations have fallen to low levels when governments have followed interventionist economic policies and that higher valuations have returned when governments have tended to let markets work. Although today’s equity investors appear to be unlikely to benefit from rising valuations (in the way that they did during the 1950s and 1990s), it would take a major reversal of the direction of government policies to bring valuations significantly downward.
Also in This Issue:
Fixed-Income Investment Strategies
Newly Recommended Funds
The High-Yield Dow Investment Strategy
Recent Market Statistics
The Dow-Jones Industrials Ranked by Yield
To access the full article, please login or subscribe below.
Already a Subscriber?
Log in now
Subscribe Today
Get full access to the Investment Guide Monthly.
Print + Digital Subscription – $59/YearIncludes 12 Print and Digital Issues
Print + Digital Subscription – $108/2 Years
Includes 24 Print and Digital Issues
Digital Subscription – $49/Year
Includes 12 Issues
Digital Subscription – $98/2 Years
Includes 24 Issues